Company Overview
![]() McDonald’s Corporation franchises and operates McDonald’s restaurants in the food service industry. These restaurants serve a varied, yet limited, value-priced menu in more than 100 countries worldwide. All restaurants are operated either by the Company or by franchisees.
McDonald’s Corporation franchises and operates McDonald’s restaurants in the food service industry. These restaurants serve a varied, yet limited, value-priced menu in more than 100 countries worldwide. All restaurants are operated either by the Company or by franchisees.
Income Statement and Cash Flow
McDonald’s business model is rather simple. The company has two sources of revenue: 1) Sales from company operated McDonald’s restaurants, and 2) Rent and royalty payments from franchised stores. Sales from the company’s 6,399 operated stores account for 67% of revenue, with franchise fees for the remainder.
What makes this such a great business for investors is the low cost, predictable cash flow of the franchise model. Though McDonald’s usually owns the land and building, the locally-owned restaurant is responsible for operating costs and day to day management. Most franchise arrangements have 20 year minimums, so once a restaurant opens, MCD can rely on 20 years of low maintenance, reliable income.
The past 10 years have had an annual revenue increase of 5.44%, and last year, 2010, saw a revenue increase of 5.86%. Part of this increase is from the 541 new restaurants opened in 2010, and the rest is from the strong comparable sales growth MCD has had. 5% global comparable sales growth in 2010 marks the 8th straight year of such increases.
| Years | Revenue (in millions) |
|---|---|
| 2006 | 20,895 |
| 2007 | 22,786.6 |
| 2008 | 23,522.4 |
| 2009 | 22,744.7 |
| 2010 | 24,076.6 |
EPS and FCF per share have also shown strong growth, averaging 15.4% and 22.9% over the last decade. 2010 saw an EPS increase of 11.4%, from $4.11 to $4.58. Analysts expect MCD to earn $5.05 in FY 2011 and $5.51 in FY 2012. This would be an increase of 10.3% and 9.1%, respectively. Analysts predict a 5 year growth rate of 9.4%.
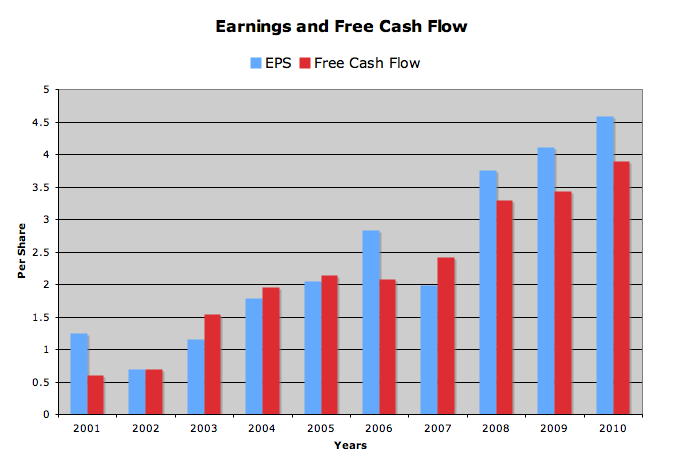
Earnings growth comes from a combination of increased sales and margins, plus the effects of strong stock buybacks. MCD has averaged to take 4.7% of it’s stock off the market every year for the past decade. In 2009 the board approved 10 billion dollars in share repurchases, and to date, they have roughly 6.9 billion dollars left to use, with no expiration on the cash.
Cash flow has grown from 2.7 billion in 2001 to 6.3 billion in 2010. Combined with the share buybacks and slowly increasing capital expenditures, FCF per share has grown faster than EPS. The $3.86 of free cash flow in 2010 was more than enough to cover the $2.26 in dividends.
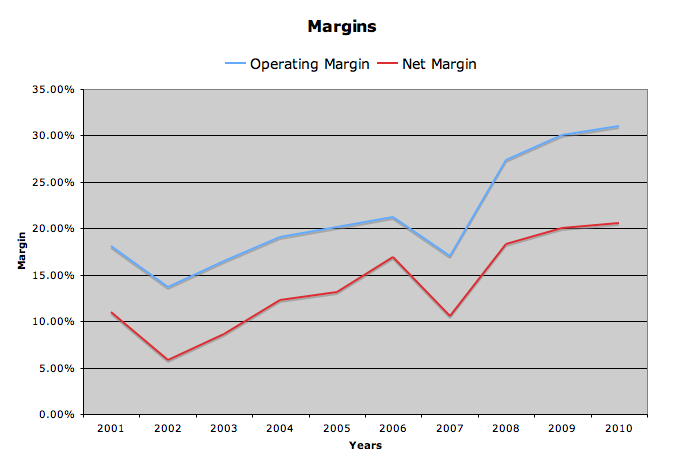
Margins have been trending upwards, a great sign for the business. I was having trouble finding a reliable gross margin number, but online research pegs it somewhere in the high 30′s – low 40′s, percentage wise. As with all food companies, rising commodity prices may affect MCD in the future, but if any company could deal with increasing raw material costs, it’s McDonald’s.
For one, they are one of the largest food buyers in the world, which gives them incredible leverage. Second, 75% of their grocery bill is comprised of only 10 different commodities. Their streamlined operation allow them offer a full menu with only a few ingredients, thereby reducing costs and simplifying purchasing. Third, they have pricing power. You can buy a hamburger anywhere, but you can only get a Big Mac at McDonald’s. This allows them the freedom to raise prices in order to offset higher food costs.
Dividends
MCD is a dividend powerhouse. They have increased their dividend every year since paying their first one in 1976, and I believe this will continue into the future. The current quarterly rate of $0.61 a share equals an annual dividend of $2.44, and the stock currently yields 3.3%.
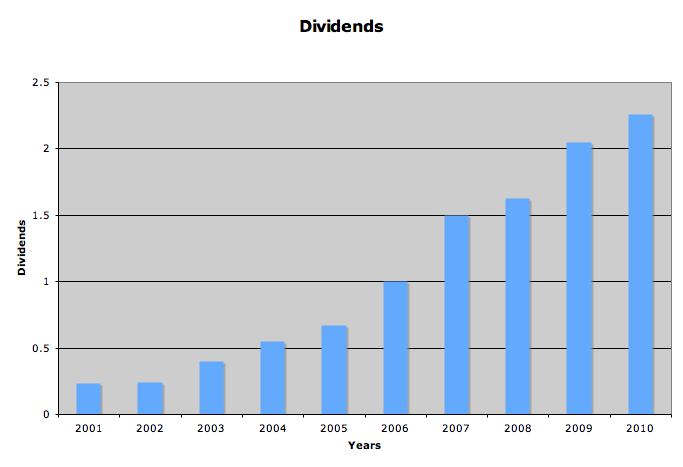
Based on dividend history, we can expect an increase in the fourth quarter of 2011, so the yield is probably a bit higher. If we estimate a dividend increase of roughly 10% (similar to 2010 increase), that would mean an annual payment of $2.49, and a yield of 3.4%
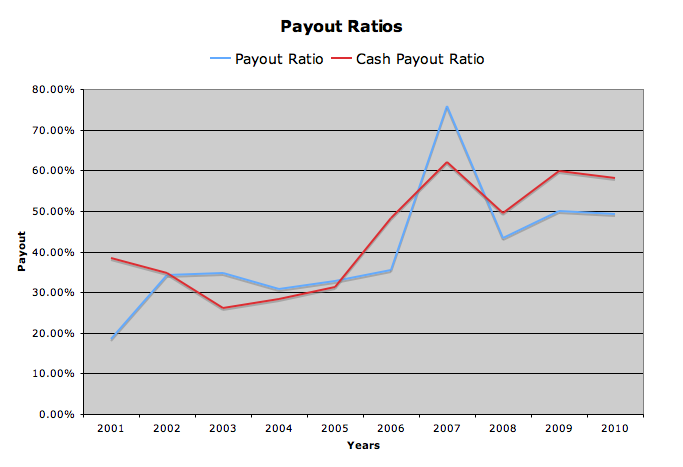
10 year average annual growth rate is 28.58%, almost double the EPS growth rate. This was achievable with a mix of strong earnings growth and an increased payout ratio. Since 2001, the payout ratio has increased from 18% to 49%. I expect dividend growth to slow in the coming years, as the increases of the past decade are unsustainable, and the 5 year rolling dividend growth rate is trending down. A 10% growth rate going forward is reasonable. Any higher, and the payout ratios may head into dangerous territory.
Balance Sheet
McDonald’s has a healthy balance sheet.
The current ratio is 1.49, and debt is 44% of capital employed. This is a bit higher than I usually like to see, but interest coverage is a healthy 16.6, and they have over 2 billion in cash. They should have no problems servicing their debt.
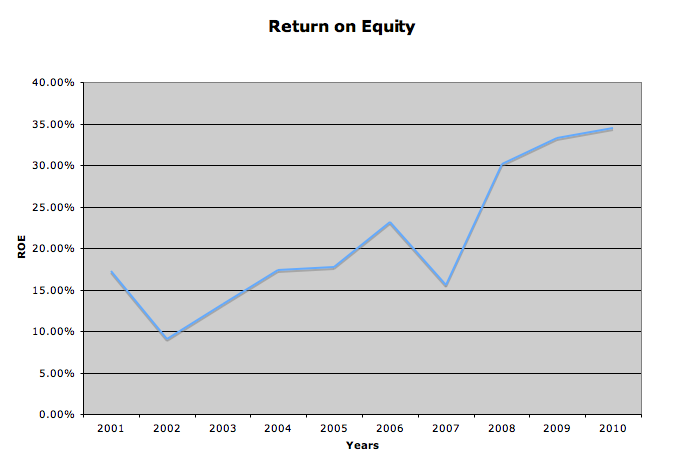
Return on Equity has been trending upwards, and is rather high, at 34.5%. Some of this is attributable to the leverage of the company, but most of it is just great management. The past 3 years have kept ROE into the low 30′s, but for most of the 2000′s it was in the mid teens to low 20′s. The 10 year average is 21.2%, a very respectable number.
Stock Price Valuations
current price - 73.38
5 year low p/e - 14.1
p/e (ttm) - 16
p/e (forward) - 14.5
peg - 1.7
5 year high dividend yield - 3.6%
dividend yield - 3.3%
Conclusion
There is a lot to love about McDonald’s. 32,737 restaurants. World-wide brand appeal. A proven business model. Great management. A commitment to shareholder returns. Consistently strong growth. Quality assurance labs around the world to make sure every product is up to standards. And unbelievable brand loyalty. I know, because I am incredibly brand loyal. None of my road trips are complete without a sausage egg mcmuffin.
The future also looks bright for the Golden Arches. They have shown the ability to expand into new markets, while also adding value to their existing stores. There are 1,100 new store openings planned for 2011, and they should all add nicely to the bottom line.
Based on the average of the 5 year high yield, 5 year low p/e, and a discounted cash flow analysis (9% EPS growth, 10% return, over 10 years), McDonald’s is still an attractive buy in the low 70′s. I will add my position when, and if, funds are available and my allocation is balanced.
To get all my updates, please subscribe to my rss feed
Full Disclosure: I am long MCD. My Current Portfolio Holdings can be seen here
 For Canadians, November is


 Stock share buybacks or share repurchase plans have become all the rage on Wall Street lately with the stock market’s excellent run so far this year. In fact, in the first quarter of 2013, companies in the United States have
 A recent reader questioned the validity of a
  Dividends are like the third rail for public companies. Most board members and executives would much rather do something drastic like borrow money instead of reducing their dividend payments to shareholders. So, there is something to be said for dividend aristocrats who continue to raise their dividends year in and year out improving their
 ).
).


 For Canadians, November is


